Business Process Management 101
Course Availability
Description
Business Process Management 101 – Face-to-Face
$1,195.00
BPM 101 is the foundational course for those starting their BPM journey. It presents an overview of process modeling, analysis, design, the technologies in BPM and the role of BPM in digital transformation.
Master the Skills You Need to Lead in BPM
Business Process Management (BPM) isn’t just a methodology or a tool – it’s a management discipline that forms the foundation for all continuous process improvement. While some think BPM is simply process modeling, it’s much more than that. BPM is about understanding, improving, and managing how work gets done across your organization.
The BPM Specialist Certificate gives you the practical skills, frameworks, and credibility to advance your career in process improvement. Developed and taught by experienced practitioners, this program goes beyond theory to teach what works in real projects and real organizations.
For anyone serious about a career in BPM, this certificate is essential. Employers look for professionals who can deliver structured, measurable improvements – and with BPM training, you’ll be prepared to do exactly that.
Who Should Earn This Certificate?
This certificate is ideal for:
- Business analysts and process professionals looking to formalize and expand their BPM expertise.
- Project and program managers who want to integrate BPM practices into their initiatives for better outcomes.
- Operations leaders and team leads responsible for performance, efficiency, and process governance.
- Professionals pursuing BPM certification to distinguish themselves in the market and increase earning potential.
What You’ll Learn
In this program, you’ll build your BPM skills step by step:
Start with the Big Picture in BPM 101
- Understand what BPM really is (and isn’t) so you can explain it clearly to colleagues and leaders.
- Learn how BPM drives improvement and creates value for organizations – insights that will help you get buy-in for your projects.
- Discover how to connect processes to business strategy to ensure your work delivers meaningful results.
Learn to Map and Analyze Processes in Process Modeling, Analysis & Design
- Gain practical techniques to document processes so everyone can follow them – no matter how complex.
- Build models that go beyond simple flowcharts to show how work truly happens across teams and systems.
- Explore tips to spot broken steps, bottlenecks, and inefficiencies so you can design better ways of working.
Measure What Matters in Process Measurement & Metrics
- Learn how to choose the right metrics to measure process performance effectively.
- Discover how to create meaningful measures that go beyond activity counts to reflect customer and business value.
- Build your confidence in using data to make decisions and communicate results persuasively to stakeholders.
Drive Sustainable Change in Establishing Business Process Governance & CoE
- Understand what it takes to build a strong process culture in your organization.
- Learn how Centers of Excellence support BPM maturity and how you can contribute to or build one.
- Explore practical governance frameworks that keep processes effective, compliant, and continuously improving.
Courses Included
Complete these four courses to earn your Specialist Certificate and digital badge:
- BPM 101
- Process Modeling, Analysis & Design
- Process Measurement & Metrics
- Establishing Business Process Governance & Center of Excellence
Credential
What You Earn
![]() Business Process Management – Specialist Certificate
Business Process Management – Specialist Certificate
- Digital badge for LinkedIn, internal systems, or resumes
- Proof of practical, applied BPM capability in process roles
How to Earn It
- Complete all four required courses.
- Choose the delivery format that works best for you:
- On Demand: Learn at your own pace, anytime.
- Live Online: Join scheduled interactive sessions remotely.
- In Person: Attend immersive classroom courses.
- Private Live Online: Schedule dedicated online training sessions for your team (group offering only).
- In-House: Bring our instructors onsite for private team training (group offering only).
- No final exam or capstone required.
- Complete in as little as four days or spread out your learning to fit your schedule.
Your BPM Specialist Certificate and digital badge will be issued automatically upon completion, ready to showcase on LinkedIn, internal systems, or your resume.
Credential Path
Start here:
BPM Specialist Certificate (4 courses)
Go further:
 BPM Professional Certificate
Complete the Specialist Certificate plus additional advanced BPM courses to earn your BPM Professional Certificate.- Certified Business Process Management Professional (BPMP)
Achieved by passing the BPMP certification exam, this credential is ideal for experienced professionals seeking industry-recognized distinction and expanded career opportunities.
Each level builds on the last — from structured skill development to advanced leadership and formal certification.
Earning your BPM Specialist Certificate will give you more than just a credential – it will change how you approach your work every day.
- Advance your career and earning potential. Professionals with BPM certificates earn up to 25% more because employers trust their ability to deliver results.
- Increase your confidence. You’ll know exactly how to tackle process problems, design improvements, and explain your decisions clearly.
- Get projects moving faster. With structured methods and practical tools, you’ll reduce rework and deliver improvements more efficiently.
- Strengthen your credibility. Gain recognition as someone who understands how to make processes work better for people, customers, and the business.
- Speak a common process language. Gain the shared terminology and frameworks needed to work confidently with colleagues, leadership, and cross-functional teams.
- Communicate with impact. Learn how to present process changes and data so stakeholders understand and support your recommendations.
- Become a trusted advisor. Whether you’re working on process documentation or leading enterprise-wide change, your skills will help you influence and guide teams with confidence.
What You’ll Be Able to Do
By the end of this program, you will:
- Clearly explain what BPM is and why it matters in any business context.
- Map and model processes using industry standards so they are easy to follow, analyze, and improve.
- Spot bottlenecks and inefficiencies and know how to redesign processes for better performance.
- Choose the right metrics to measure success and use data to back up your recommendations.
- Plan and lead process improvement projects with a structured approach that drives results.
- Understand what it takes to build a process-focused culture and contribute to establishing Centers of Excellence.
- Apply governance practices that keep processes effective, compliant, and continuously improving.
- Confidently communicate process changes, designs, and improvements to any audience.
- Use a common BPM language to communicate processes, improvements, and recommendations clearly to any audience.
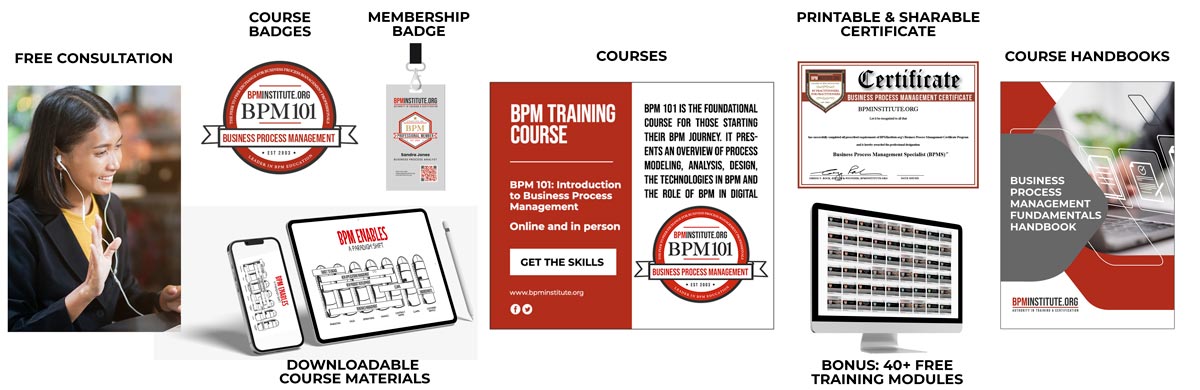
All packages include:
-
- 4 days of training (approximately 24 hours in length)
- One-Year professional membership
- Downloadable course materials
- Handbooks for every course
- BONUS: 40 additional free training modules
- State-of-the-art LMS
- Sharable and printable digital credentials
- Free training consultation
Save a bundle with one of our flexible packages.
On Demand Package
Cost: $2,349.00
Complete your certificate 100% online. On demand courses are available 24/7/365 from your PC, phone or tablet.
eLearning Package
Cost: $2,849.00
Attend both instructor-led, live online courses and on demand courses. They allow you to interact with instructors and fellow students.
Private Learning Package
Cost: $3,349.00
Dedicated training sessions for your team based on your schedule. Requires a minimum of six participants.
Face-to-Face Package
Cost: $3,849.00
Our most flexible package allows you to register for any delivery method you wish. Attend any of our on demand, live online or face-to-face events as it fits your schedule.
Take Your Expertise Further
![]() Looking to earn formal recognition beyond the certificate? Pursue the Certified Business Process Management Professional (BPMP) credential.
Looking to earn formal recognition beyond the certificate? Pursue the Certified Business Process Management Professional (BPMP) credential.
This industry-recognized certification validates your professional competency and enhances your credibility, proving to employers and peers that you are qualified to lead BPM initiatives with excellence.
Certified BPMPs enhance their professional experience by obtaining recognition of their competency and proving that they are professionally qualified to practice their profession. BPM certification helps employers define job objectives, evaluate position candidates, assess employee performance and motivate employees to enhance their skills and knowledge. BPM certification supports the advancement of BPM professionals by providing a way to measure and document the knowledge and skills required to be recognized as a competent practitioner.
Explore our Learning Paths to discover courses that match your career path.
See just what BPM can do for you and your organization.
*BrainStorm Group, its related companies, and its BPM/BPMP brands are not affiliated with Project Management Institute and its PMP brand.