Time is a critical dimension of customer satisfaction and cost reduction. Getting products and services to customers in a speedy fashion is a value-adding activity. By beating your competitors to market, you gain sales and market share.
As a cost-reduction strategy, time reduction can be very effective. Inspection, moving, setup, rework, and waiting all add costs. The amount of time in these areas can be staggering. Table 1 illustrates the percentages of time in various process categories.
Table 1
| Time Category | Typical Percentage of Total Cycle Time in a Process Processing |
| Processing | 2% to 30% |
| Waiting | 30% to 70% |
| Rework | 20% to 50% |
| Moving | 10% to 30% |
| Inspecting | 5% to 15% |
| Setup | 2% to 20% |
“Processing time” means the time spent actually doing work in a particular process. It’s through processing time that a product is made or a service delivered. As you can see in Table 1, processing time – where actual work is performed – is remarkably low in the total process cycle time, just 2 to 20 percent. In addition, only a small portion of that amount is value-added time. Hence the percentage of value-added time in a process can be just a tiny fraction of the total process cycle time.
Wait time is measured from the perspective of the item in the process, not the person doing the work. For example, if you’re working on something and you stop to answer a phone call, the work you stopped doing must wait while you’re working on something else (in this case, answering the phone). As you can see, wait time encompasses the largest percentage of time in a process.
Rework comprises the next largest category of time. Six Sigma experts often call this area the “hidden factory.” These are all the extra activities performed because the work wasn’t done right the first time. Table 1 shows that 20 to 50 percent of total process cycle time can be consumed by rework.
Both formal and informal rework steps make up the hidden factory. Formal rework is done after a formal inspection step, for example, following a quality-control check at the end of an assembly line. If an error or mistake is discovered, the item is put into the rework queue. The informal step occurs when someone upstream checks his or her work before passing it along. If this person catches an error, he or she reworks the problem.
Moving time is fairly straightforward and occurs whenever the work is moved from one place to another. Shortening the distance that the work must travel is a common technique to cut down on moving time.
The final category is setup time (in manufacturing this is called “changeover”). Setup is any activity that’s done prior to performing the actual work required for the process step. In manufacturing, for example, this could be configuring equipment with dies, bits, calibration, and so forth so that it can perform the task. In service, setup could include scrolling through computer screens to find the one needed for the process. Another example is locating files or information before starting the task.
When all the categories of time are added together for one step, you get the total time for that step. Adding all the total times together will give you the cycle time for the process. Cycle time is the total amount of time from when a process starts to when it ends.
Every time category in Table 1 that follows processing time is non-value adding. The customer doesn’t want to pay for waiting, rework, moving, inspecting, and setup. With the time lens, you’ll want to focus on all the non-value added steps and try to eliminate or reduce them. After you’ve done that, look at the processing steps and try to shrink them as much as possible.
Process Cycle Time Analysis
Figure 2 shows a document that helps track all the different categories of time in a process.
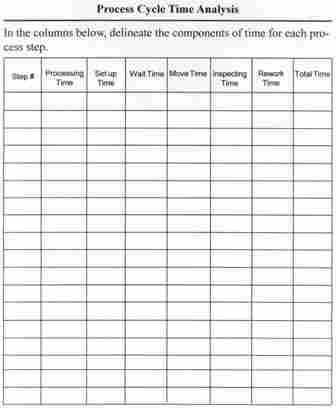
Figure 2: Tracking categories of time in a process.
You’ll need to use the functional-activity flowchart when filling out the time sheet. Each step in the flowchart, which you numbered earlier, corresponds to the step numbers listed in the process cycle time analysis sheet. Using a stopwatch, record the times for each step on the time sheet. To get a representative sample, do a time analysis of different operators at different times during the day. (This is a variation on the old time-and-motion studies done decades ago.)
Figure 3 shows seven steps in a process recorded on the process cycle time analysis sheet. Step four consumes the most time at 130 minutes, including a whopping 120 minutes of wait time. This step is a formal review by the department manager, and the work often stalls here for quite a long time. The manager sees he’s created a bottleneck and has decided to delegate review to another person if he’s busy.
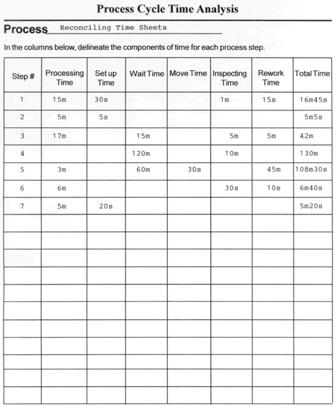
Figure 3: Process Cycle Time Analysis
Step five is the next longest step at 108 minutes and thirty seconds. The two major contributors to total time for this step are wait and rework time. Find the root cause of the rework to eliminate this issue. The wait time is due to a heavy workload by this person. The team using this time analysis sheet is considering cross-training another person so that more than one person can do step 5.
Travelers
Another way to gather time is with a document called a “traveler.” It’s attached to the work and “travels” with it through each step. With the traveler you can calculate process, wait, and cycle times. Figure 4 is an example of a traveler sheet.
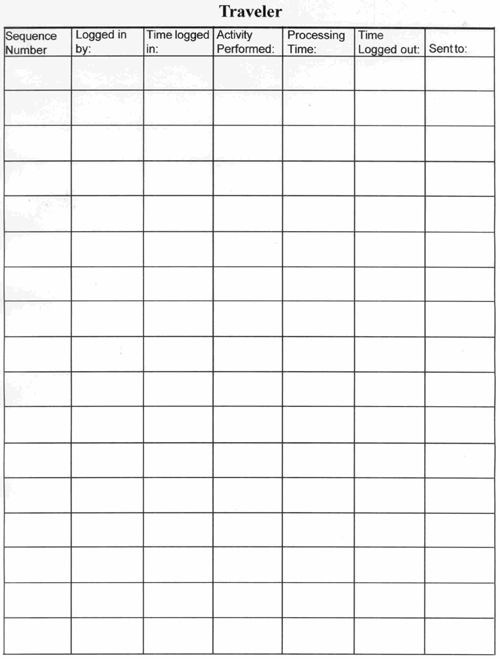
Figure 4: Traveler Sheet.
The sequence number in the first column refers to the numbered steps on the functional-activity flowchart of the process. The first person to log in would be the person identified on the functional-activity flowchart by his or her job title. With a time stamp or clock, the person records when the work is first touched. Under the “activity performed” column, this information should match the activity that’s already been described in the functional-activity flowchart. Under the “processing time” column, the person estimates the amount of time he or she worked at this step, not counting interruptions. When the individual is done, he or she indicates the time the work was finished under the “logged out” column. Under the “sent to” column, the individual records who should receive the work next. When that person gets the work, he or she repeats logging and tracking time.
The time when the work is logged in to when it’s logged out comprises the total cycle time for each step. Subtracting processing time from total cycle time will give you wait time. You can also derive this figure by subtracting the time logged in from the time logged out. That wait time is added to the logged-in person’s time.
Remember that cycle time equals processing time plus waiting time. In equation form, it’s:
Cycle time = Processing time + Wait time
Figure 5 represents a data sheet constructed from the traveler that shows process time and cycle time for each step. The percentage column is calculated by dividing processing time by cycle time at each step. A high percentage means there’s very little wait time for a particular step. For example, steps one, three, and five have 100 percent in the percentage column; hence, there’s no wait time in those steps. However, step six has a meager 6 percent. That means work (i.e., processing) is happening only 6 percent of cycle time at this step, and wait time takes up 94 percent of cycle time.
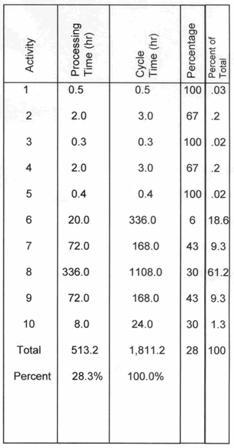
Figure 5: Data Sheet for Process and Cycle Time
One way to use the traveler is to construct a table like the one shown in Figure 5. A first-pass method of analysis is to peruse the percentage column and scan for low percentages of processing time to total cycle time. Because step six is listed as only 6 percent, it’s an obvious candidate for reducing wait time.
The final column, percentage of total, indicates the percentage of total process cycle time is consumed in each step. You can calculate this by taking the cycle time for each step and dividing it by the total cycle time for the process. For instance, at step eight, cycle time is 1,108 hours. Total cycle time for the process is 1,811.2 hours. If you divide 1,108 by 1,811.2, you’ll get a percentage of 61.2. Thus, step eight consumes 61.2 percent of total process cycle time.
Obviously, if time reduction is your goal, you should look at steps that consume the most time. Because step eight consumes the most time in this process, it should be the first one analyzed. It doesn’t make sense to start with step one because it consumes only .03 percent of the total process cycle time.
Hopefully you will find the time lens to be an important part of your business process analysis and improvement. Use the data to shrink time and costs and so that services and products can be delivered faster to your customers.