Digital transformation was always a 5 year plan that could be put off because it was so painful. But COVID has forced organizations to make dramatic, transformational changes in 5 months or 5 weeks. And the pace of change has not let up as organizations are evolving to stay relevant in very uncertain times.
Never has it been more important that the executives and managers have accurate dashboards and reports to be able to drive business decisions. But are they looking out of the windshield of the car or out of the back window?
Put another way, are the Key Performance Indicators (KPIs) that they are using to make their decisions leading indicators or lagging indicators? Lagging indicators vs. leading indicators
Some examples of lagging and leading indicators:
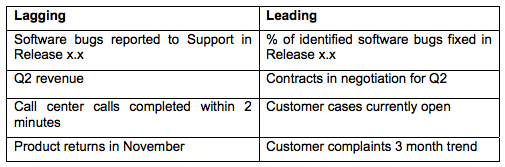
Things can start to go wrong in a business well before the performance measure turns the traffic light on the scorecard red. Using metrics that measure past events is like driving while looking through the rear window. It’s easy not to see an opportunity or threat on the road ahead until you’re upon it. So if leading indicators are clearly more valuable than lagging, why do many (most!) projects seem to deliver reports and scorecards full of lagging indicators?
There are probably 3 reasons:
- Lagging numbers are the easiest to find in the corporate databases and regular monthly reports. They are the easiest to identify, especially if you do not have intimate insights into the operation of the business. When IT is under pressure from the business to deliver “scorecards for the top team,” lagging indicators are the quickest way to satisfy the demand. So does is really matter? Well — yes. Firstly, delivering lagging indicators means that the business has a good idea of how well it has done, but reveals little about whether a direction / strategy is working. So, not only is it wasting a manager’s time to be looking at reports that are only showing a historical position, but, more importantly, it is squandering the opportunity to gain a competitive advantage. Remember — “If it’s difficult for you, it’s probably equally difficult for your competition.”
- Secondly, the promise of ROI from the scorecarding project is not being realized. Scorecards should not be just the latest management fad for senior management. They are valuable tools to be placed in the hands of managers and supervisors — in fact, anyone managing a team — to aid in making decisions. As this is not always how they are used, it is not surprising that Gartner, in the famous “Hype Cycle,” sees Scorecarding as being over the “Peak of Inflated Expectations” and sliding down into the “Trough of Disillusionment.”
Not a new problem
This problem is not a new one, but the terminology has changed; the technology is a little cheaper to implement and the metrics easier to capture. Twelve years ago, I was one of the IT directors at the DSS, the UK Government Social Security organization. I had 500 staff in eight locations and a budget of $58m. In my large office (protected by a fierce secretary in the outer office), I had a PC with an analytics platform with lots of traffic lights reporting on my organization’s performance.
I had no choice in setting the traffic lights or how the data that made them turn green, amber, or red were compiled. A complex application powered by mainframes crunched numbers for weeks to produce a set of traffic lights that only the senior directors saw. But those traffic lights weren’t connected to any of our project processes or to any other definition of activity. I had no way of knowing what to do to change a traffic light from red to green. So I simply accepted the green lights, and used the amber and red lights as early warnings to prepare my excuses for the next management meeting.
Having an analytics platform that creates performance data that isn’t connected to an organization’s activities is like trying to play a video game with a disconnected joystick. The game is still in play (people are still at work), but the player (management) can’t influence the action. Today’s technology ensures that data is produced more quickly and can come from more sources. But this doesn’t make it any more useful for delivering a better result. If an improvement was needed to be able to catch up with or hit a milestone, then my question was always the same “What are we going to do differently?” And “Work harder” is not necessarily the correct answer.
Changing the paradigm
To understand why scorecarding projects are failing, we need to understand what is meant by failure:
- Projects are stalling and not being rolled-out across the organization.
- The information on the scorecards is not supporting decision-making.
So how do we change the way we deliver scorecarding projects? We need to ensure that they help corporate decision-making at all levels in the organization, rather than allowing them to become a senior executive’s toy, played with for a few weeks until the next new thing comes along. Unless the scorecard adds real long-term value, it will be quickly discarded and never adopted at lower levels in the organization where it can do most good. We need to change the idea that a scorecard is simply a collection of interesting numbers that people need to see; we need to think about the scorecard in a more structured way. There are 2 key principles that should be applied: “top down” and “driven from the process.”
Top down & process driven
Metrics are hierarchical, and therefore the metrics that are driving the behaviors of junior supervisors, managers, and executives should all be in alignment. That means the overall KPIs of the business should be identified first — and normally they are. You can often spot at least some of them in the company’s Annual Reports. The difficulty then is in breaking these down to lower levels, which is where the second principle comes in — “driven from process.” Unless you have a clear understanding at every level of the organization about what the end-to-end process is, then it is very difficult to identify the correct metrics to drive the business. Remember — You get what you measure, so measure the wrong thing and you get the wrong behaviours.
You may be able to identify the metrics at the highest level or even at the 2nd or 3rd level, but at the lowest levels it becomes impossible to identify metrics that are leading AND aligned with the goals of the organization. To achieve both these objectives, you will need to develop the process and metrics hierarchy in parallel — each feeding the other. Putting it into practice At the highest level there are 5 or 6 key activities, each having a metric.
Each activity can be broken down into lower and lower levels of detail, each with the same simple diagramming structure of “input-activity-output,” and, from that, the leading and lagging indicators at each level will (surprisingly) pop out fairly quickly. This combines the principles of Balanced Scorecard and the process improvement techniques such as LEAN or Six Sigma.
The benefits of this dual approach are
- Alignment of the end-to-end processes from the senior management level down to the shop floor
- Alignment of the metrics senior management level down to the shop floor
- Leading indicators identified at each level
These ideas and principles have been proven in major corporations around the world over the last 5 years. Companies such as Toyota, Lockheed Martin, Avaya, Taylor Woodrow, Orange, and Department of Health have delivered staggering results by applying them:
- “We reduced the worldwide SAP implementation for 40 countries from 36 months to just 18 months.”
- “It provides demonstrable corporate governance, improving business performance and pinpointing shortcomings costing more than $26.1m.”
- “It has played a significant part in winning more than $43.5 million of new business and reducing costs by $8.3m and projected annual savings of $6.5 million per annum.”
- “We brought white-collar productivity up to match our envied blue-collar levels.”
The final word — Agility
Think about driving alongside a pavement crowded with Christmas shoppers. Some pedestrians step out and, thanks to your lightning reactions and the ABS on the car, you swerve and manage to avoid hitting them. So agility is all about whether you are able to respond if something jumps in front of you. The measure is “Did you hit them?” You could have been just as “agile,” but required a far less violent reaction, if you had been alert to the possibility and had had earlier warning of the pedestrians’ actions. There is a strong parallel with corporations. Many are striving to be so nimble that they can change direction in an instant, but are failing because a nimble 10,000-person organization is an oxymoron. It is practically impossible, especially when you realize the increasing demands to comply with various pieces of legislation. So a better approach is to be prepared for change (process) and have early warning (leading metrics).