Every business analyst and consultant has drawn a flowchart at some point in their career. Many probably still are.
Type “flowchart” into Google and you get 75 million results. Type “horse and cart” into Google and you get 380 million results. But the car has superseded the horse and cart.
In the same way, flowcharts are now an outdated way of capturing process content. Over the last 5-10 years there is a simpler and more engaging diagramming notation. It is proven in major highly regulated industries right down to innovative startups and small nonprofits. It is called UPN (Universal Process Notation) and it is not proprietary to any company and doesn’t require any specialized software.
Why the change?
- The diagrams need to be developed and viewed online rather than printed out and pasted on conference room walls. They are often created in collaborative web-conferences rather than in-person meetings.
- They need to be understood by a range of stakeholders with different backgrounds and disciplines with a short attention span.
- They need to cope with both wide ranging (lead to cash) and narrow focused (raise quote) processes.
- They are often the input / specifications for system implementations so should be used for UAT (user acceptance testing) and training.
- They need to be used to support the different regulatory regimes.
- They are a living document that exists beyond any specific project as they are the “operations manual” of the company.
What are the specific diagramming changes?
We need smaller / tighter and more easily understood diagrams that can be viewed online and embedded in webpages and apps so:
- No more than 8-10 activity boxes on a screen.
- Drill down from any activity box to a lower level to describe more detail.
- Attach supporting info to activity box.
- Viewed with ability to collaborate with secure access rights.
- A mechanism for capturing improvement and suggested changes.
- Version control with a mechanism for capturing suggested improvements.
This approach is described as UPN (Universal Process Notation). The notation is not linked to any application software.
https://www.tibco.com/sites/tibco/files/resources/wp-nimbus-universal-process-notation.pdf
Comparison: Flowchart (old) – Process Map (new)
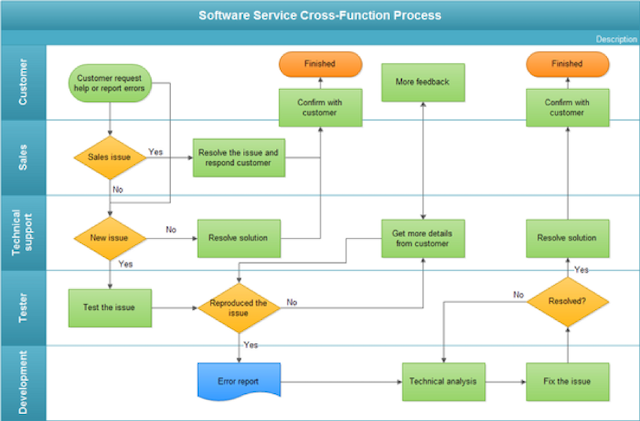
Typical flowchart with swimlanes and decision boxes.
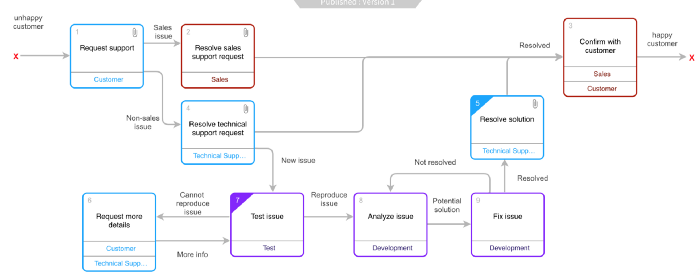
Taking the information in this flowchart example and applying the simple UPN notation of “Who needs to do What, When, Why and How?” Note how much simpler this is with a clear left to right flow, and more information and less ambiguity.
Some subtle but critical aspects of UPN
Activity boxes start with verbs; this makes the processes more accurate/specific. Avoid using ‘manage’
Activity boxes have a ‘resource’ rather than positioned on a swimlane; this enables the diagrams to be tighter with a more logical flow left to right and activity boxes can have multiple resources.
Lines with text exist between every activity box; these are the handoffs between processes and are absolutely fundamental as many process issues are a misunderstanding on what the handoff criteria are e.g. what is the shared and agreed definition of “qualified lead” or “closed opportunity”.
Decisions are several lines coming out of an activity box with line text explaining flow; this reduces the number of activity boxes on a diagram without losing any of the information.
Drill downs give more detail; this enables the diagrams to be kept to 8-10 boxes, but still describe a broad scope or complex processes. There is no limit to the number of levels you can go down (shown as corners).
Attachments show documents/metadata/metrics in context; this reduces the time to find the related documentation (shown as paperclips).