Change isn’t easy. It’s not something most of us seek out. But for any company who intends to remain healthy and competitive in an increasingly global and electronic marketplace, change is continual and necessary. Market downturn or other external factors may force us to become more efficient at what we do. Other times the need for change comes from within – a response to new product or service offerings, system enhancements or reorganizations, for example.
“As the business grows, it gets increasingly difficult to know what is going on
in the business… and impossible to know what’s not going on.”
– Phil Crosby, “Toward the Intelligent Enterprise : A View from the Infrastructure Level”
To determine the effectiveness of change, an organization must have a baseline by which they can evaluate whether they are moving closer or farther from their intended goal. This baseline describes the business functions, processes, systems and roles affected by the project in both textual and visual forms.
But wait…isn’t that a waste of time? It’s obvious we already understand our current environment – we do the work today, so why focus on the current when we can leap directly into defining the future? Our experience has shown that the “obvious” isn’t always well understood. Taking the time to collaboratively explore how the current world works will:
- Highlight value and non-value added steps
- Enhance awareness of the work each organization contributes to the process
- Capture knowledge that might otherwise be lost or hidden
- And may reveal otherwise undiscovered opportunities
There are many tools which can be used to describe the current environment; but the most common are the Textual Description, Context Diagram and Process Map. We recommend that these tools or models be developed collaboratively in a group setting to get the maximum benefit from knowledge sharing.
Textual Description
Written description of the product or service, supported by tables that depict current pricing structures, security access, product features and other relevant information. These descriptions represent aspects of the current environment that are not typically captured in the other models.
Context Diagram
The Context Diagram graphically depicts the information flows between the current process, product, system or application and necessary internal and external vendor systems in the target environment. This model originated from the classic structured analysis work done in the late 1970’s by Tom DeMarco and Ed Yourdon. In addition to providing a better understanding of the existing environment, this model can assist in:
- Communicating the scope of the current process
- Identifying potential project stakeholders
- Validating existing “interfaces” or information flows
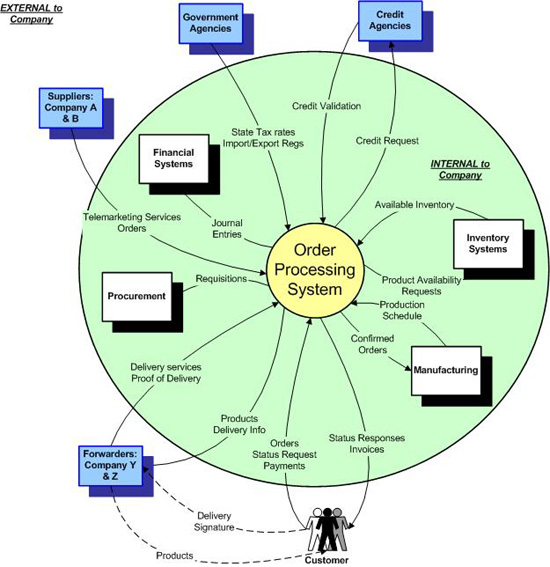
Figure 1 – Context Diagram Example
In the model, the circle indicates the “area of focus”. The boxes display the sources or receivers of information (internal or external agents) and the labeled arrows depict the type and directional flow of information.
Process Map
Process mapping is one of the most common techniques used in process analysis. It has been used for years, but has gained notoriety more recently as a substantive tool within many quality-based methodologies. It is indispensable for understanding the detail of how a process works and can be easily annotated to include information regarding who does the work or where the work gets done. It can also be annotated with costs, time, or other characteristics that may be relevant to the project effort. It is a flexible and valuable tool that belongs in every analyst’s toolbox. The collaborative development of a process map allows team members to:
- Clearly understand “how” the work gets done and “who” does it.
- Compare / contrast current work flow with target work flow to understand the gaps between the two.
- Highlight and give visibility to work complexity.
- Understand a “blueprint” or baseline for a process, from which situational variations can be modeled.
- Comprehend the discrete or cumulative costs or time involved in the process.
Figure 2 – Process Map Example
There are a variety of possible symbols that can be used for process mapping, but the simplest and most fundamental set of conventions parallels those used in ANSI standard flowcharting (as shown above).
In summary, understanding and documenting the workings of your current product, process, service or system provides a firm foundation for measuring progress. It gives you a baseline to measure improvement and ensures that the right people are involved in the change. We highly recommend that these models be created as a team effort to improve the level of accuracy while enhancing overall awareness across the organization.