Taking the Process Map to the Next Level – The Visual Analysis Map

Registration is free. Login or register to view/download this content.

Author(s)

Faculty Member, BPMInstitute.org and President, i4 Process
Ms. Shelley Sweet is a Faculty Member of BPMInstitute.org and President of I-4 Process (Ideas, Involvement, Implementation, Impact) in Palo Alto, California. www.i4process.com Shelley works with companies that need to transform the way they do work and use information. She provides a unique method of modeling processes and analyzing data that accelerates operational improvements, and builds leaders and employees who sustain process excellence. She is the author of a new book, The BPI Blueprint: A Step-By-Step Guide to Make Your Business Process Improvement Projects Simple, Structured and Successful, which is available on Amazon.

What if you could create a visual that showed your data gathering, problem solving and analytical thinking analysis all in one place?  What if you could have a map which would enable you to talk to stakeholders and executives and get their input on problems, time delays, and key quality issues?  That’s what the Visual Analysis Map can do for you and your team.

Many of you have developed “As Is” process maps.  If you’ve built them with a team you’ve seen how the method helps employees see how their part impacts the whole process, begin to shift from blaming others to a process focus, and generates all kinds of improvement ideas.

What if we could take the map from this historical document to a whole new level of engagement, dialogue, and idea creation?  That’s what I do next with the team when we create the Visual Analysis map.  I use a number of visual symbols and tools to display the analysis process. These symbols are:

  • Green dots with unhappy faces
  • Red dots with clocks
  • Orange post-its
  • Hot pink data boxes
  • A notched time line
  • Blue post-its

 Green dots with unhappy faces

Now stand back, look at the map, and have a discussion. Where do the dots cluster?  What problems do they represent? Is a problem later in the map caused by something that is missing earlier in the map? Often the team will also suggest solutions for some green dots that are very simple and can be implemented immediately. Do so!

 Red dots with clocks

Orange post-its

Now as you step back and analyze the map, question the team to identify areas where they need to do some root cause analysis using continuous improvement tools such as check sheets, Pareto Diagrams, and Five Whys. Once this more detailed analysis is complete, the team can post their analysis sheets and conclusions on the Visual Analysis Map.

The notched time line is put on the bottom of the map. This time line configuration is a standard tool of Lean and often used on the value stream map. It shows the time each step takes and the time in between each step. A notched time line is shown in the Sales Compensation Swim Lane map below.

 A notched time line. Click thumbnail image to view full sized image.

Now you can easily see where the time wasting steps, decisions, and time between steps exist.  These are obvious improvement areas. This step complements the red dot step of delays, but gives you a bigger picture of the time line for the whole process.

Hot pink data boxes

I use data boxes in two ways – to determine where to collect data and to record the data we discover. To determine where we need to collect data, I pass out one bright pink sticky and ask each team member to find a place on the map where they think it would be useful to collect some data. Later when the data is collected, record the actual data discovered by filling in actual numbers in the data boxes on the Visual Analysis Map.

Blue post-its

The team has done significant analysis and it’s all up on the map.  The map has come alive! The map is now a Visual Analysis Map.  Now when the team displays the map in the work place or in a War Room, there is lots more to talk about to colleagues and stakeholders. Team members can

  • Bring other colleagues over and ask them to add green employee frustration dots to the map.
  • Ask employees which quality problems they think are critical.
  • Get employees involved in collecting data or in doing some of the root cause analysis.
  • Let employees comment on how the dots and stickies cluster in certain areas.
  • Bring in Senior Management and look at the Visual Analysis Map together.  Tell them about the data you collected, your analysis, and initial improvement ideas. Listen to their questions and ideas.
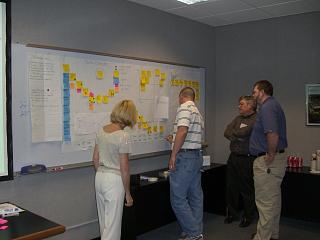
Team working on a Visual Analysis Map.

The Visual Analysis Map takes the process map to the next level.  It is distinctive because it

  • Allows others to see the thinking of the team
  • Is interactive, enabling discussion and insights within the team and with other stakeholders
  • Is one place where analytical information is summarized and  visible to all
  • Is the single place where information is integrated and can be viewed  across the whole process
  • Enhances understanding of the full process which leads to building better relationships and solutions

As I work with teams and create the Visual Analysis Maps, I also ask them to come up with other ideas to make their work more visual. Sometimes they go out and take pictures in the work environment and post them at critical steps with a short caption. I am sure you will be able to find other visual cues that you can put on your map, which are relevant to your process and its analysis. Each will improve your communication, analysis and improvements.

Similar Resources

Featured Certificate: BPM Specialist

Everyone starts here.

You're looking for a way to improve your process improvement skills, but you're not sure where to start.

Earning your Business Process Management Specialist (BPMS) Certificate will give you the competitive advantage you need in today's world. Our courses help you deliver faster and makes projects easier.

Your skills will include building hierarchical process models, using tools to analyze and assess process performance, defining critical process metrics, using best practice principles to redesign processes, developing process improvement project plans, building a center of excellence, and establishing process governance.

The BPMS Certificate is the perfect way to show employers that you are serious about business process management. With in-depth knowledge of process improvement and management, you'll be able to take your business career to the next level.

Learn more about the BPM Specialist Certificate

Courses

  •  


Certificates

  • Business Process Management Specialist
  • Earning your Business Process Management Specialist (BPMS) Certificate will provide you with a distinct competitive advantage in today’s rapidly evolving business landscape. With in-depth knowledge of process improvement and management, you’ll be able to take your business career to the next level.
  • BPM Professional Certificate
    Business Process Management Professional
  • Earning your Business Process Management Professional (BPMP) Certificate will elevate your expertise and professional standing in the field of business process management. Our BPMP Certificate is a tangible symbol of your achievement, demonstrating your in-depth knowledge of process improvement and management.

Certification

BPM Certification

  • Make the most of your hard-earned skills. Earn the respect of your peers and superiors with Business Process Management Certification from the industry's top BPM educational organization.

Courses


Certificates

  • Operational Excellence Specialist
  • Earning your Operational Excellence Specialist Certificate will provide you with a distinct advantage in driving organizational excellence and achieving sustainable improvements in performance.


OpEx Professional Certificate

  • Operational Excellence Professional
  • Earn your Operational Excellence Professional Certificate and gain a competitive edge in driving organizational excellence and achieving sustainable improvements in performance.

Courses

Certificate
  •  

  • Agile BPM Specialist
  • Earn your Agile BPM Specialist Certificate and gain a competitive edge in driving business process management (BPM) with agile methodologies. You’ll gain a strong understanding of how to apply agile principles and concepts to business process management initiatives.  
 

Business Architecture


Certificates

  • Business Architecture Specialist
  • The Business Architecture Specialist (BAIS) Certificate is proof that you’ve begun your business architecture journey by committing to the industry’s most meaningful and credible business architecture training program.

  • Business Architecture Professional
  • When you earn your Business Architecture Professional (BAIP) Certificate, you will be able to design and implement a governance structure for your organization, develop and optimize business processes, and manage business information effectively.

BA CertificationCertification

  • Make the most of your hard-earned skills. Earn the respect of your peers and superiors with Business Architecture Certification from the industry's top BPM educational organization.

Courses


Certificates

  • Digital Transformation Specialist
  • Earning your Digital Transformation Specialist Certificate will provide you with a distinct advantage in today’s rapidly evolving business landscape. 


  • Digital Transformation Professional
  • The Digital Transformation Professional Certificate is the first program in the industry to cover all the key pillars of Digital Transformation holistically with practical recommendations and exercises.

Courses

Certificate

  • Agile Business Analysis Specialist
  • Earning your Agile Business Analysis Specialist Certificate will provide you with a distinct advantage in the world of agile software development.

Courses

Certificate
  • DAS Certificate
  • Decision Automation Specialist
  • Earning your Decision Automation Certificate will empower you to excel in the dynamic field of automated decision-making, where data-driven insights are pivotal to driving business innovation and efficiency.