A Prominent factor of international business today is its strategic direction. Global firms are competing with a wider variety of business and operational strategies and with more complex operational strategies today compare to 12 years before.
This makes more challenging for global operation to deploy same model for its internal business where economic and market conditions are different. This can resolved by providing a unique national strategy and dedicated modification of key activities for each major country; this facilitates customizing the business around each countries market.
A global business and operational strategy world is considered as signal market where corporate goals are common. This brings international operations to tough spot of performing as stand-alone entity.
Under global operational strategy to concentrate geographically located activities in a way that captures most of the available economies of scale and factor cost advantages.
BPM Vs ROI
BPM considers processes to be strategic assets of an organization that must be understood, managed, and improved to deliver value added products and services to clients. The need of optimization and streamline the operational activities for global companies are historical.
Here are some of the facts:
- There is no clear formula or mathematical model available for exact mapping of cost associated with BPM/Dependent projects and ROI. Benefits are multi dimensional compare to single direction.
- ROI is a critical factor for any larger corporation/ senior management to know before approving any BPM related investment as its not in critical path of company success.
- Major corporations/companies understand the needs/benefits of optimal strategies for operating models to save cost. But don’t want to invest on BPM due to unknown ROI.
- There are initial up front cost associated with BPM installation and adopting this model.
Determining ROI & NPV for BPM : Tracking direct benefits in terms of cost saving for short term (1 Year) and long term (5 year) period.
- Improvement to operating structure/efficiency due to BPM,
- Reduction in day to day breaks, failures, rework compare to previous year,
- Optimized staffing model consist of reallocation of roles and responsibilities( globally or low cost area) as Business Process Modeling exercise
- Reduction in risk exposure with more control points determined with help of BPM
- Standard and enhanced End – 2 – End detailed process maps to reflect companies’ policies and procedural (Direct saving on External/internal audits & Time spend on audits with reduced exceptions).
Tracking In-direct Benefits in terms of cost saving
- Due to more standardized documentation and process mapping, Ease of change management or future enhancements as indirect benefit
- Centralized location of Policies & Procedures with details End – 2 – End mapping for cross reference.
- Direct contact and interaction with IT and business staff due to seamless integration.
- Ease of brining “New client on-board” and developing new strategies to accommodate need of clients.
- Centralized Business analysis & Project Management efforts with more control.
- Expansion of BPM model to other department with minimal efforts and reduced external expertise.
- Regulatory and compliance benefits and support to compliance certifications.
Sample ROI Model calculation
|
||||
| Saving on Activities due to .. | Approximate Saving (+/- 20% ROE) | |||
| %/Month 1 | Equiv of Staff/Yrs 2 |
$ Approx 3 | ||
| End -2 End Documentation | 10% | 0.2 | 16000 | |
| Efficiency on GAP Remediation | 15% | 0.3 | 24000 | |
| Process Automation | 20% | 0.4 | 32000 | |
| Smooth Handovers (Reduced rework) | 10% | 0.2 | 16000 | |
| Reporting Automation | 10% | 0.2 | 16000 | |
| Billing Automation | 15% | 0.3 | 24000 | |
| Work Flow Events Automation | 20% | 0.4 | 32000 | |
| Regulatory Fines/Expenses | 15% | 0.3 | 24000 | |
| Project Management | 20% | 0.4 | 32000 | |
| Overall Improvement | 135% | 2.7 | 216000 | |
|
||||
| Saving on Activities due to .. | Approximate Saving (+/- 20% ROE) | |||
| %/Month 1 | Equiv of Staff/Yrs 2 |
$ Approx 3 | ||
| Standardized approach & Procedures | 10% | 0.2 | 16000 | |
| Standard error codes | 5% | 0.1 | 8000 | |
| Streamline Alerts & Notifications | 10% | 0.2 | 16000 | |
| Ease of Change management | 15% | 0.3 | 24000 | |
| IT Interaction and Modification | 15% | 0.3 | 24000 | |
| SLA & Audit support | 10% | 0.2 | 16000 | |
| Employee Satisfactions | 10% | 0.2 | 16000 | |
| Reduction in External BPM SME | 30% | 0.4 | 32000 | |
| Overall Improvement | 105% | 1.9 | 152000 | |
|
|||||
| Years | BPM Investment($) 4 |
Approx Exp. ($) | Direct Impact Savings |
Net Benefits (Excl. indirect Benefit) $ | |
| Licenses | FTE (Consult)5 | (4K + FTE*85K) | |||
| 1 | 4000 | 2 | 164000 | 216000 | 52000 |
| 2 | 4000 | 0.75 | 64000 | 216000 | 152000 |
| 3 | 4000 | 0.5 | 44000 | 216000 | 172000 |
| 4 | 4000 | 0.1 | 12000 | 216000 | 204000 |
| 5 | 4000 | 0.1 | 12000 | 216000 | 204000 |
| Total Invest | 296000 | Total Saving | 784000 | ||
- ROI Calculation:
Total Investment= 296000 (Over 5 years)Total Saving (Excluding in-direct savings) = 784000IRR (Companies rate of return) = 6% (Usually between 6 % – 8%)
Gain or Loss on Investment ($) = 488,000 Term =5
ROI (%) = 164.9%
Simple Annualized ROI (%) = 33%
Based on above case study, this example presents a comprehensive view of rate of return on investment by incorporating BPM with business and operation. Here it clearly shows that “Direct Impact or saving” are greater in time and more strategic to incorporate BPM in addition to “in – direct benefits”. The overall approval for any company/ department can be quantified / justified based on above calculation by plugging in their numbers.
Adoption and Best Practices
Its always advisable to incorporate BPM for detail analysis and integration of operation – technology is to take “incremental approach” at enterprise level.
Biggest obstacle for adopting BPM are “Culture, resources, funding” because for larger organization where multiple division need to coordinate for initial roll-out.
This is being found very beneficial for financial organization to adopt BPM strategies from most troublesome, complex or distributed business area to start with smaller approach to see the impact. Because BPM modeling provides very quick and direct visual perspective of gaps and Issue areas of larger financial processes. This helps managing business planning, reporting , integration and activities associated through closed loop.
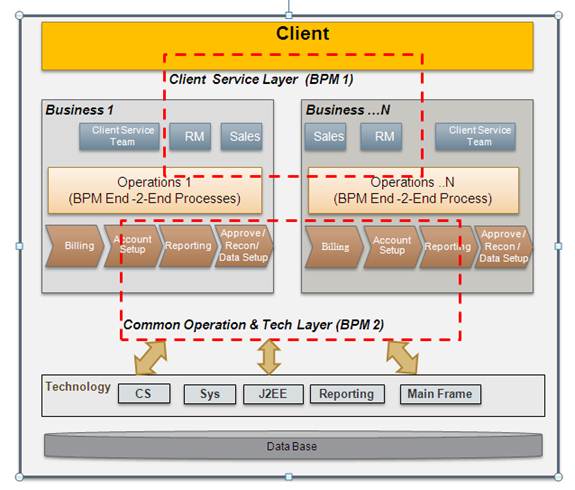
Sample Business Architecture Model
References & Assumptions
* ROE: Rate of Error* 1 – % saving in terms of HRS converted to approximate per month distribution.* 2 – Saved Time per Year approximate resource saving (Considering standard 40 -50 Hrs/week)* 3 – 1 FTE – Approx salary nearly 80K /Year * 4 – BPM Licenses( Multiple) approx 4 K (Enterprise level could be cheaper)* 5 – BPM FTE Cost from vendor for installation and training (Approx 30 -40 Hrs/Week)* IRR – Normally its 6 % – 8 %*