There has been a lot of debate lately about the usefulness of BPMN (Business Process Model and Notation) to business managers. Some say that it’s too complicated and unintuitive and that it’s better suited to IT people. Others say business managers must spend time learning to read BPMN notation to find it more useful. Then there are those who say they use a sub-set of BPMN symbols to simplify models so that business managers can understand them. What’s more, little is said in the debate about the process modeller’s skills. Is all this criticism of BPMN justified or is this simply a case of poor workmen blaming their tools?
Process modelling is a skill. Regardless of what symbols are used, the modeller must employ good notation and know-how to communicate with stakeholders—business people and IT people alike. It’s the modeller’s job to create value by revealing hidden activities in the process and to share this new knowledge with others so they can make good business decisions. For anyone who questions BPMN’s usefulness, one thing is clear: when coupled with good technique, BPMN significantly enhances the information level the modeller conveys to the broadest audiences.
Simple Flow Charts To Detailed Models
Before BPMN, most process models were simple flowcharts. These models were relatively simple and the insights they offered limited, as was their value. To create them, modellers used a core set of symbols: shapes for start and end events, boxes to represent activities, diamonds to show flow control, and arrows to sequence them. Additional symbols gleaned from process mapping software also found their way into these models, boosting the information level conveyed. These models helped businesses design and configure their IT systems and coordinate new workflows. But once the projects ended, the models lost their value.
When BPMN was introduced in 2001, it didn’t seem all that different from other mapping notations, at least to some users. But BPMN 1.0 contributed some highly useful innovations to the art of modelling processes. One was the elegant way in which it enabled modellers to depict the impact of external events on processes, particularly exception flows. Few processes proceed directly from start to finish without an outside event impacting it: customers may cancel orders, patients may miss appointments, components may fail, and materials may be out of stock.
Process modellers usually ignored exception flows before BPMN. Those that tried to map them found their maps expanding massively. The resulting flows were inelegant and of limited value. For example, a modeller might include a decision point for stock not being found, to allow for the event that the stock figures were incorrect. But that’s not what actually happens. What happens is that the warehouse worker simply goes to get the item and finds that it’s missing. When mapped with basic workflow symbols, this process looks something like the example below:
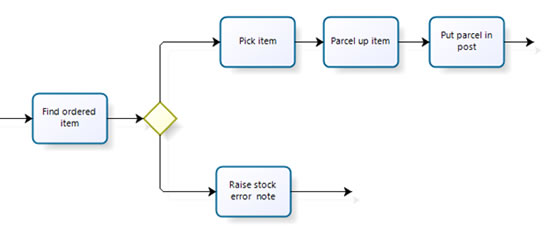 |
This example contains two noteworthy points. Firstly, the task before the pathways split is defined in terms of what is achievable in its entirety before the pathways split. Hence, the task is to ‘find’ the ordered item. When this task is done, the item is either found or not found. From a process perspective, it has barely progressed. Secondly, the sequences are pictorially indistinguishable. By convention only, the most common flow is placed upper most, but that is the only clue as to which flow is the preferable path. Standing back from this map, there is no quick way to identify the more desirable route.
Now look at the same flow using BPMN’s notation for an exception flow:
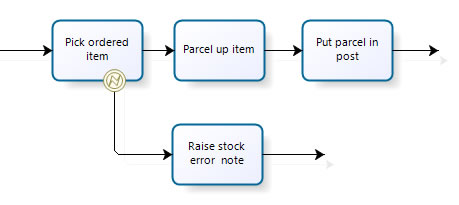 |
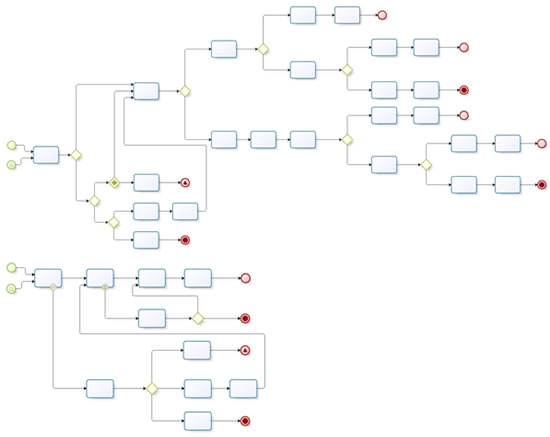
Here, the first task’s definition is no longer constrained to the point where an exception can occur and can be more roundly defined as “pick ordered item.” The item is then ready to pack before placing it in the mailbag. The normal flow, therefore, has three tasks not four, and they more closely fit with the worker’s steps. In addition, placing the error event on the boundary makes it obvious which flow is normal and which the exception. The BPMN notation indicates the presence of an exception flow and doesn’t require the reader to study the details closely. This “browseability” may not seem like a great advantage initially, but in a larger process, it could be significant. Compare the two equivalent processes below. The first doesn’t use exception flows, the second does.
 |
Additional BPMN Innovations
Another BPMN innovation is the set of “gateways” the notation uses to control activity sequencing. Previously, these flow controls were called “decisions.” But this often confused people. Instead of thinking about how the sequence of activities is controlled, they think about all the decisions made throughout the process.
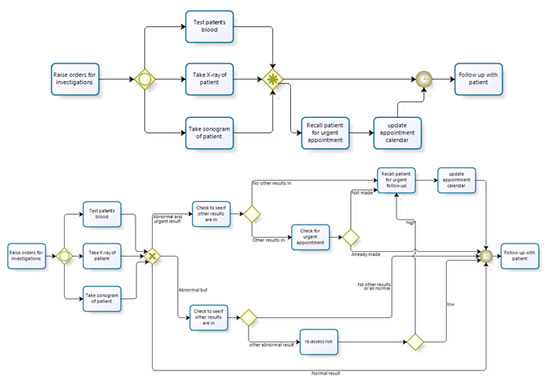
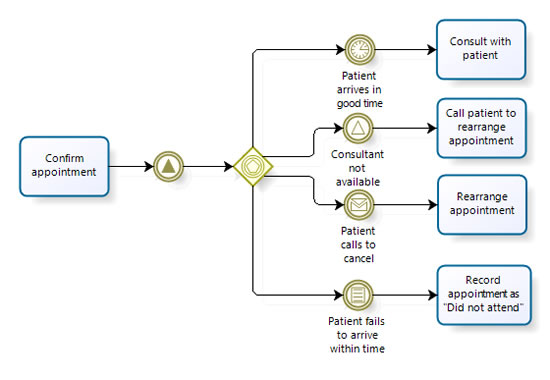
Clearly, a “gateway” is a better metaphor for this activity. Flow proceeds through whichever gate is “open” (programmatically that evaluates to TRUE). In BPMN there are two novel gateways that enable a mapper to more accurately convey sequence control. The first recognises that the control can be complicated. Compare the two examples below. The first uses a complex gateway to indicate flow to a routine patient appointment or to an urgent one. The second shows how the choice is made but there are still only two options: routine or urgent.
 |
The second gateway allows for sequences independent of previous activities.
 |
A third BPMN innovation is the use of a new type of connector, the message flow, and the pool to show interactions between organisations. With the Internet’s growth, e-commerce and business process outsourcing, the number of electronic interactions between departments has increased dramatically. Understanding their sequencing is critical to ensuring business processes run smoothly. Referred to as “choreography” in BPMN, this connector enables process maps to communicate a deeper understanding of supply chains, shared processes, and other cross-organisational interactions. The example below shows the interaction between a client, its supplier and two service providers.
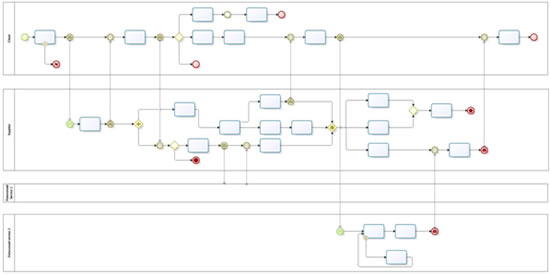 |
New Version Stirs Debate
The OMG (Object Management Group) introduced BPMN 2.0 in January 2011. Featuring a name change , two new forms of models, and an increase of more than 200 pages added to the specification, the new version has stirred considerable debate. The introduction to BPMN 2.0 says that the specification’s primary goal is providing a notation readily understandable by all. But some business managers feel that BPMN 2.0 sacrifices this goal in favour of another goal—the executability of BPMN 2.0 models by XML languages. The addition of class diagrams and XML schemas within the specification make it more than a little indigestible for business managers. In fact, these changes give many business managers the impression that the standard is geared specifically for IT people.
However, within version 2.0 there are several useful features for process modelling that business managers will find useful. Take for example BPMN’s ability to indicate the triggering of an exception flow while continuing the process. Let’s say a truck driver may find that he doesn’t have a full consignment when he comes to collect his load. A process modeller can use a “non-interrupting exception flow” to signal how the shortfall is handled while the driver continues the journey as planned, as shown below.
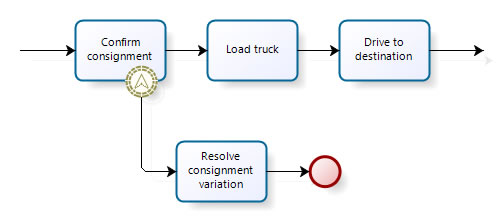 |
Take also the triggering of exception flows that occur over a number of activities, rather than at one particular activity. For example, illness may strike a performer while preparing for a concert performance but the concert preparations would not necessarily cease. An event-triggered sub-process could handle the problem as shown below.
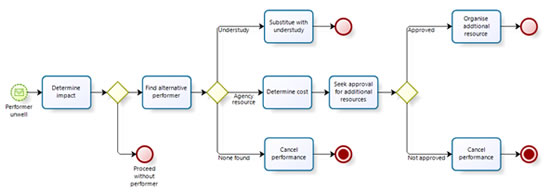 |
In short, BPMN 2.0 notation is more concise and comprehensive than its predecessor in describing real-life events.
What’s more, BPMN can help transform process models and dramatically improve the value they contribute to organisational thinking. With richer, more descriptive models, their use becomes far more ubiquitous and not just a by-product of IT projects. The following are some examples we can see occurring:
- Activity based costing – ABC is re-gaining favour in many organizations—probably because of today’s cost pressures. ABC can help managers determine the true costs of delivering a service or making a product, but it can be laborious and difficult to collate the data at the appropriate level of detail needed. A set of start-to-end process maps developed using BPMN 2.0 can greatly facilitate cost apportionment. When coupled with an analysis of value, ABC can help managers accurately assess the cost-effectiveness of business processes. Many BPM applications as well as some drawing tools, such as Microsoft Visio, support the recording of process data, including costs, duration, and resource consumption. This enables more accurate costing of services and products.
- Value and competitive advantage analysis – Management guru, Michael Porter, developed the theory of “value chain analysis” for analysing competitive strengths. Porter distinguished nine main groups of value creating activities. The interaction between these activities can often create competitive advantage. An advantage can also come from the interactions within the value chains of suppliers and customers. In developing a comprehensive suite of choreographed process maps, a modeller may be able to trace competitive strengths down to the level of a sub-process, single task, or message flow. This effort enables you to discern how easy or difficult it would be for a competitor to duplicate your processes. In other words, it tells you how vulnerable you are to competitive erosion. Having a clear idea of where your competitive strengths reside helps also when considering changes.
- Lean process improvement – Some lean practitioners don’t produce process maps. Others produce “To-Be” process maps, but use a different format, called value stream mapping, to analyze a current state. Value stream maps are easier to produce than process maps and are more than adequate for analyzing waste and customer value. But a process map drawn with BPMN 2.0 is a good alternative to a value stream map. BPMN is richer and faster than more traditional flowcharting. All the information captured in a value-stream map can be recorded just as readily on a process map as on a value stream map. Producing current-state and future-state maps in the same format means you only have to understand one type of map. That makes it easier to compare processes and locate the improvements.
- Testing process capacity and flexibility – A good process model can form the basis for simulation. Many simulation software solutions support BPMN. Some BPM suites with simulations capabilities also support BPMN. Simulation lets you corroborate issues with your processes that you have identified through mapping, such as bottlenecks and responsiveness to change in demand, waste, errors, etc. Simulation also allows you to test improvements before implementing them. If you’re redesigning a process to be more customer-centric, to eliminate queues, or to make more effective use of your people, you can assess alternatives by testing them under different conditions before making changes. Not only can this help you identify and address issues before going live, it can also help you engage stakeholders.
- Business process outsourcing – BPMN’s ability to capture greater detail and its smart method of handling interactions between different organisations reduces or eliminates the “teething” problems that often happen when a service is outsourced. Simple flowcharts often leave out important details that cause problems later on.
- Policy implementation and regulatory compliance – If a business wants an activity to be carried out within a set time limit or in a certain way, it needs controls to ensure that the processes follow policy. If the sub-processes monitoring compliance are absent, a BPMN process map will show their absences. Likewise, in addressing regulatory compliance, a process map can show where the controls are and where to capture compliance data. It can also reveal omissions and where measures are needed to meet compliance. One survey estimates that the average cost of compliance with the Sarbanes–Oxley Act of 2002 in 2007 was $1.7 million. Investing in robust process maps would lighten the cost of compliance and enable an organisation to respond more efficiently to further changes in regulations.
- Workforce planning and development – Exceptions within a process, such as those that have higher value, risk, or complexity, often require greater skill and experience to execute. Usually, that experience comes at a higher cost. Process models using swim lanes to separate the different skill requirements offer better insights into the cost-effective use of resources and their development.
Conclusion
Process models should follow Einstein’s advice: they should be as simple as possible, but no simpler. BPMN 2.0 enables modellers to more closely mirror real-life while creating more concise models. If you don’t want to see a non-interrupting exception flow, change the process, not the map. Business people will pick up BPMN naturally, if the modeller takes pains to guide them.